Implicit Function Learning
As the title implies, this article touches on two topics:
- What are implicit functions?
- How can they be learned from data for arbitrary shapes?
Naturally, we start with the first.
What is an implicit function?
You are probably familiar with the concept of functions from mathematics and programming. Both have in common that you provide one or several input(s) and obtain one or several output(s) as in . Because we want to understand functions in the context of 3D shape representation, consider the function describing the surface of a sphere centered at the origin
where and are the azimuth and polar angle and is the radius of the sphere. For a sphere with radius one () and angles we obtain .
This is an explicit or parametric way of defining the function: Given the sphere radius, we can directly compute all point coordinates on its surface for arbitrary spherical coordinates as . Here is the same function defined implicitly:
This equation provides the squared distance to the spheres surface from any point which is easier to see if we rewrite it as which is the standard form of implicit functions. All points for which the equation returns zero lie on the surface of the sphere. Further, we know that all points for which must lie inside while those for which must lie on the outside of the sphere. See the visualization above by clicking on implicit. Therefore, our function returns a signed distance and computing it for all points inside the volume we obtain a signed distance field or SDF. In doing so, we have implicitly defined the spheres surface as the so called “zero-level set”, i.e. the ISO surface at distance zero, a concept you might be familiar with in the context of elevation or ISO lines1 on topological maps.
Why are they useful?
Remember the simple but powerful equation describing all points on the surface of a sphere with arbitrary radius introduced in the beginning. Now try to find a similar equation for the following shape2:
Yeah, me neither. What we still can do rather efficiently though is to compute, for every point, whether it lies within or outside the shape. To do so, we select a second point far off in the distance that’s surely not within the shape, and connect it with our point of interest3. We then perform a triangle intersection test (as we do have a triangle mesh of our shape). For every triangle, we first extend it indefinitely to form a plane and compute the intersection of our line (or ray) with it (provided line and plane aren’t perpendicular which we can check by computing the dot product of the planes normal vector and the line). If plane and line intersect we check if the point of intersection lies to the left of all triangle edges. If so, the triangle and the line intersect4. Now, an even number of intersections means the point of interest lies outside the shape (we have entered and exited), while an uneven number implies we are on the inside.
Repeating this process many times provides a separation of the space, e.g. a cube, into exterior (red), interior (blue) and in between (white), where in between describes the surface of the shape implicitly as space that’s neither inside nor outside the shape.
Instead of only computing whether the point of interest is inside our outside the shape we can also compute its distance where a positive distance means outside, and a negative inside as in the sphere example from before5. This is a little more involved to compute for general shapes and often not necessary as we will see later. Below you can see a cross-section the surface of the zero-level set as well as the surrounding levels.
How can they be learned?
Before we dive into this question, let’s first quickly cover another: why? If you have dealt with 3D data (in the context of deep learning or otherwise) before, you may know that there are many ways to represent it, unlike for images, where the absolute standard is the pixel grid.
Each representation has its advantages and shortcomings. While pointclouds are lightweight, they are hard to process due to their disarray. Voxel grids on the other hand are easy to process with standard operations like convolutions but there is a tradeoff between loss of detail and large size. Meshes finally are an efficient representation with great properties for downstream tasks but extremely hard to learn as one needs to keep track of vertices and triangles and their interdependence6.
What we would like is a representation that is expressive, low cost (computational as well as storage wise) and easy to learn. Well, you probably see where this is going, but how is it that implicit functions combine all those magnificent properties?
Let’s begin from the end: They are easy to learn because they define a simple learning task. Learning whether a point lies on the in- or outside can be readily cast into a binary classification problem (see the probabilities tab in the figure above). The model, in our case a deep neural network, learns to assign a score (aka a logit) to each point inside our predefined volume (the cube). When passed through a sigmoid function and interpreted as a probability, the surface of the objects is implicitly defined by the decision boundary between the two classes, i.e. at probability.
On the other hand, learning to predict a signed distance to the surface is a classic regression setup. We can simply learn to minimize the difference between the actual and predicted scalar distance value for each point.
Now to understand the other two desirable attributes, let’s have a look at a network architecture designed to learn binary occupancy values: The Occupancy Network.
Occupancy Networks

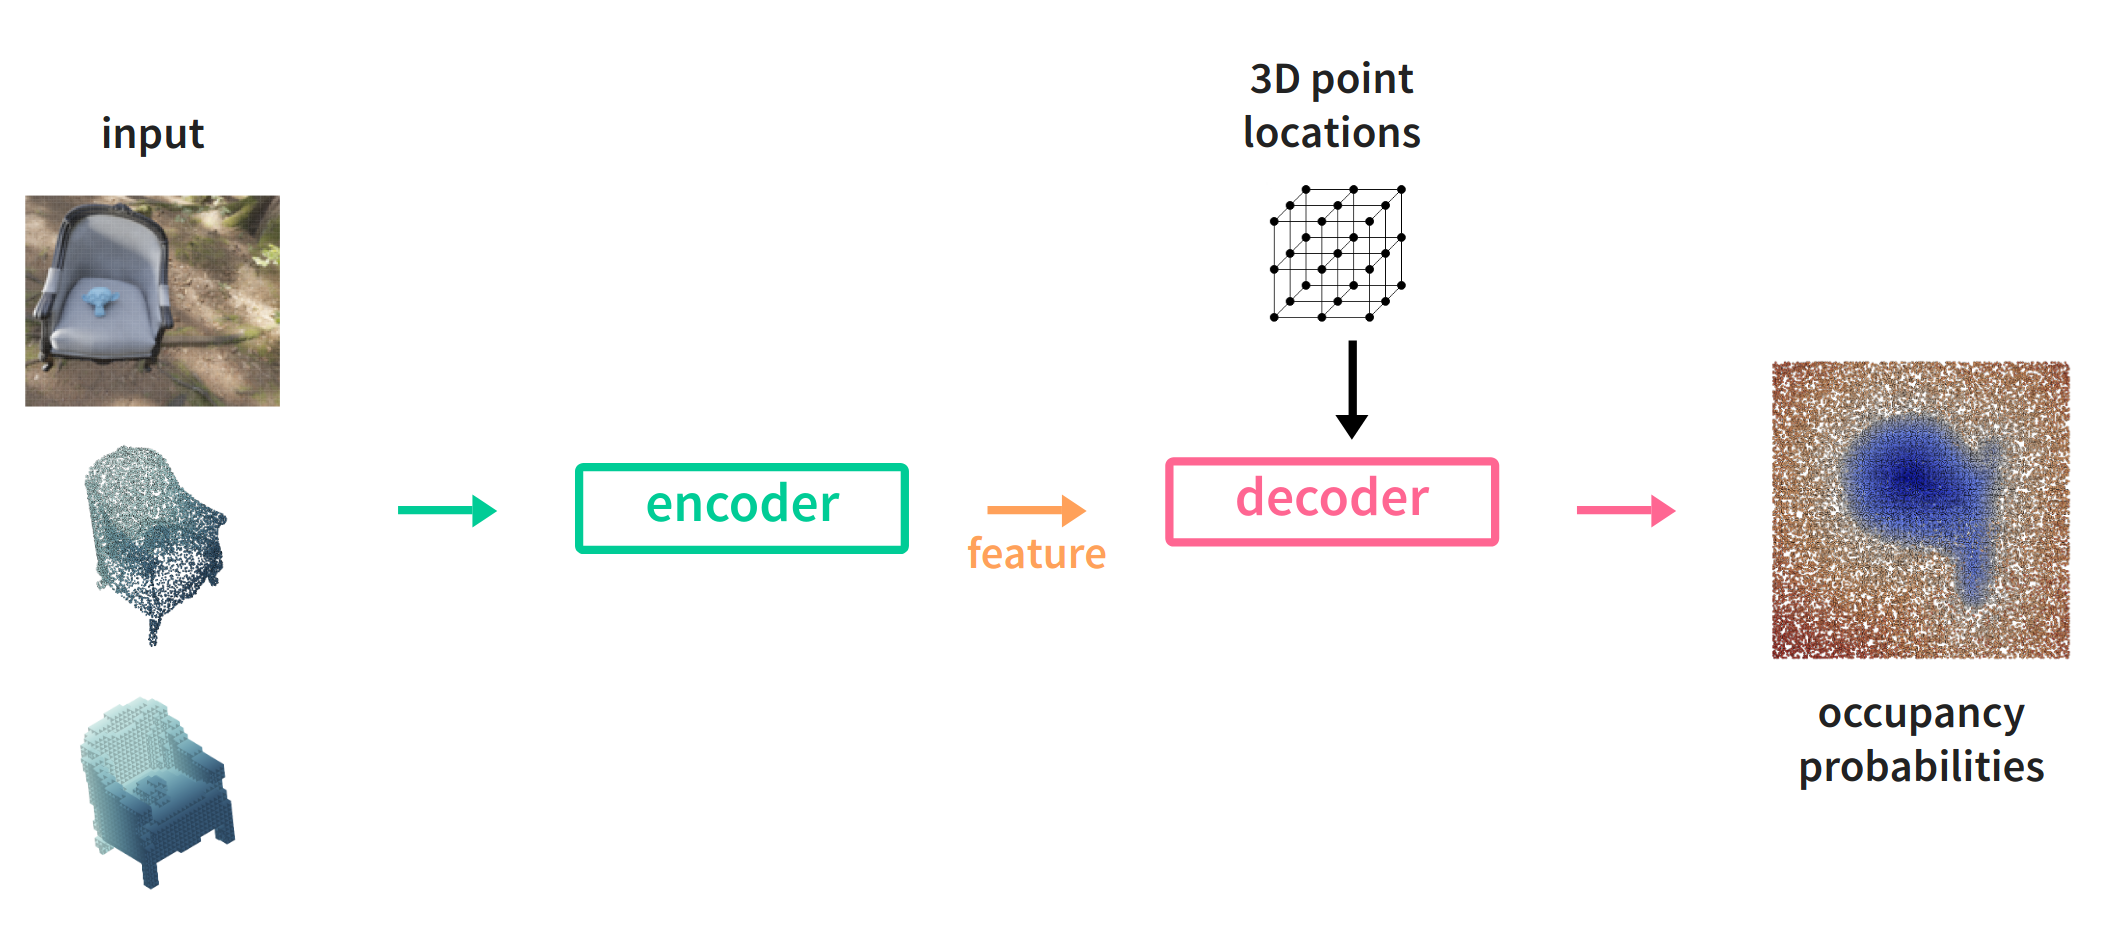
From left to right: We decide on an input data representation. Depending on it, we use an encoder build up from standard operations like 2D or 3D convolutions, fully connected layers, residual connections etc. For example, we could use a ResNet backbone (the convolutional part) pre-trained on ImageNet when dealing with images or a PointNet when the input consists of point sets (pointclouds), i.e. projected depth maps or LiDAR scans.
The output is a global feature vector describing the input. Now here comes the interesting part. We use a decoder consisting of multiple fully-connected layers (a multi-layer perceptron or MLP), hand over the global feature vector and ask it to predict for arbitrary (randomly sampled), continuous point positions to predict their binary occupancy probabilities. Close to for inside the shape defined by the input and close to for outside. Doing so many times for all shapes in our training dataset, the MLP learns, or rather, becomes a partition of space based on the input, i.e. a three-dimensional probability distribution of empty and occupied space.
This is the key to both the expressiveness and efficiency of the implicit representation as a (small) MLP can encode hundreds of shape surfaces in a continuous fashion, i.e. arbitrary resolution.
There is one problem though. As the feature vector describes the input globally, there is no spacial correspondence between input, feature and output space, so the produced shapes lack detail and are overly smooth. Luckily, this can be fixed.
Convolutional Occupancy Networks

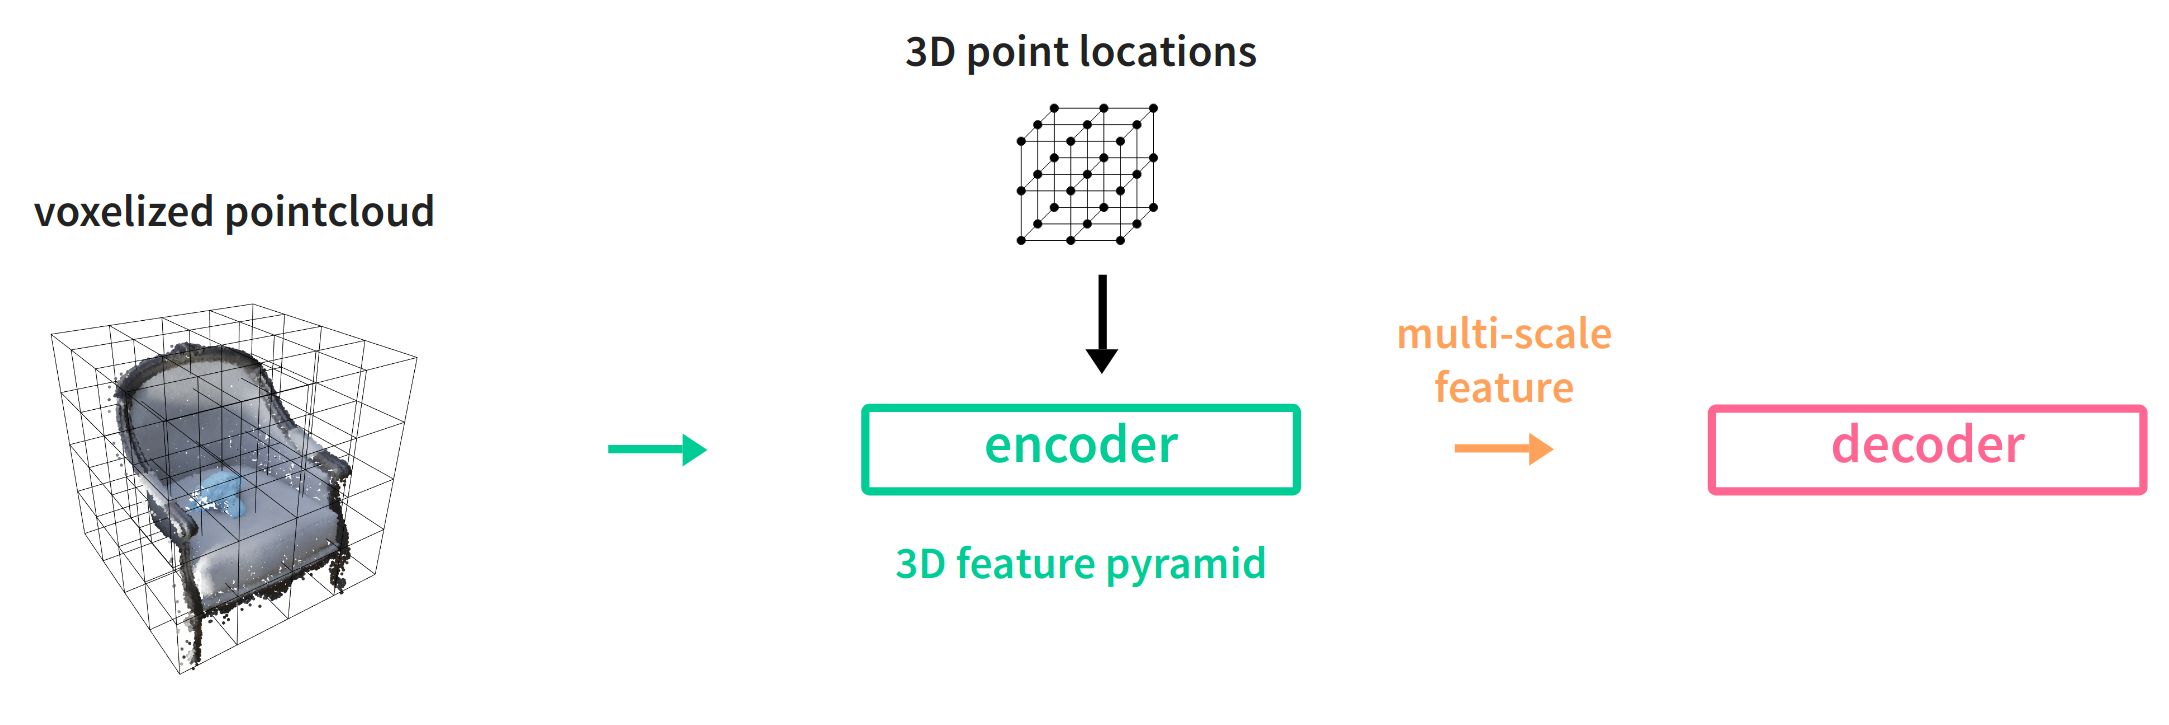
Through the division of the input space into voxels, a discrete feature grid can be constructed allowing to correlate input and output spacially with the feature space. As the grid resolution is finite, continuous point locations are matched with inpainted features from a 3D UNet and trilinearly interpolated. The decoder stays the same but is fed with higher quality features resulting in detailed shapes with higher frequency information.
Implicit Feature Networks

Finally, a similar idea has been implemented in Implicit Feature Networks, but instead of feature inpainting and interpolation on the decoder side, multi-scale features are extracted by the encoder using a 3D feature pyramid, akin to its 2D pendant known from detection and segmentation networks.
Extracting the mesh
Now, you might be wondering how to actually obtain a mesh from the implicit representation. While during training we asked the model to predict occupancies for random point positions, during inference we instead extract occupancies on a regular grid, at arbitrary resolution. Having obtained this grid where each voxel is either occupied or unoccupied (or filled with a occupancy probability or signed distance value), we can use the classical Marching Cubes method to extract the mesh.
Are there any problems?
Yes. While most works focus on benchmark data like ShapeNet, the real world is more messy. A promising application of shape completion is in robotic manipulation but the data obtained from the RGB-D cameras is less than ideal. The data is noisy, has missing parts due to overly reflective materials, doesn’t come in a canonical pose–both due to the position of the robot relative to the object and the objects pose in the world–and of course comes in very diverse shapes and sizes.
Let’s see some results!
Below there are a few visualizations of input pointclouds obtained by projecting depth images and their completions in the form of extracted meshes which you can blend in by clicking on Mesh in the legend of each figure.
As can be seen, the network is able to complete a quite diverse set of shapes, all coming from the same class (bottles) though. That’s all for today. As usual, the code for generating the visualizations can be found below. Be aware though that the data for generating the figures is too large this time, so I won’t be including it in the repository.
Code & References
-
A curve along which a continuous field has a constant value. ↩
-
Introducing Suzanne, the mascot of the awesome open source 3D software Blender. ↩
-
This is sometimes called “shooting a ray from an arbitrary viewpoint”. ↩
-
Check out this site if you are curious and want more details. ↩
-
By hovering over a point you can see its distance to the surface. ↩
-
You can read more on each representation in my previous posts on learning from point clouds, voxel grids, graphs and meshes or projections. ↩
